Invest Intelligence When It Realy Matters

Market Guidance: Past, Present and Future


NOTE: Mike Stathis predicted the precise details of the financial crisis in his 2006 book, America's Financial Apocalypse.

The Jewish Mafia REFUSED to publish this landmark book because it exposed the widespread fraud committed by the Jewish Mafia.

Instead, the Jewish Mafia published useless marketing books written by their broken clock tribesmen (like Peter Schiff's useless book which was wrong about most things and was written a year AFTER Stathis' book).

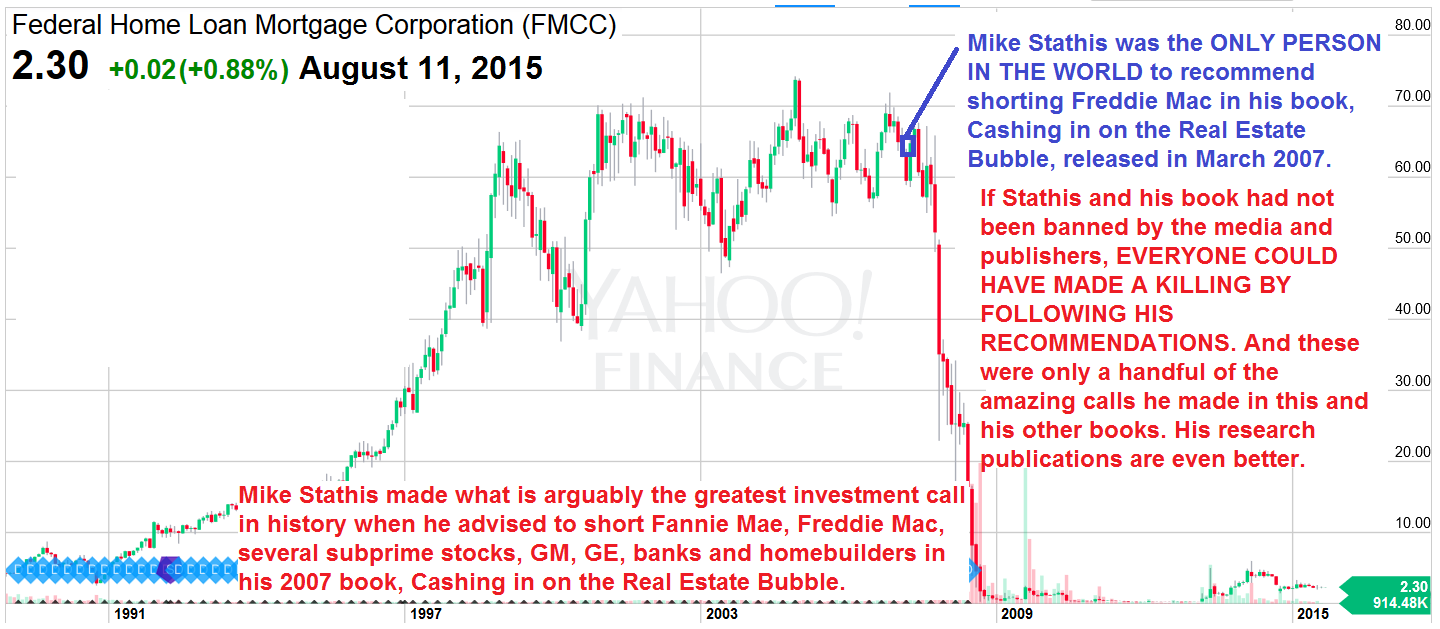
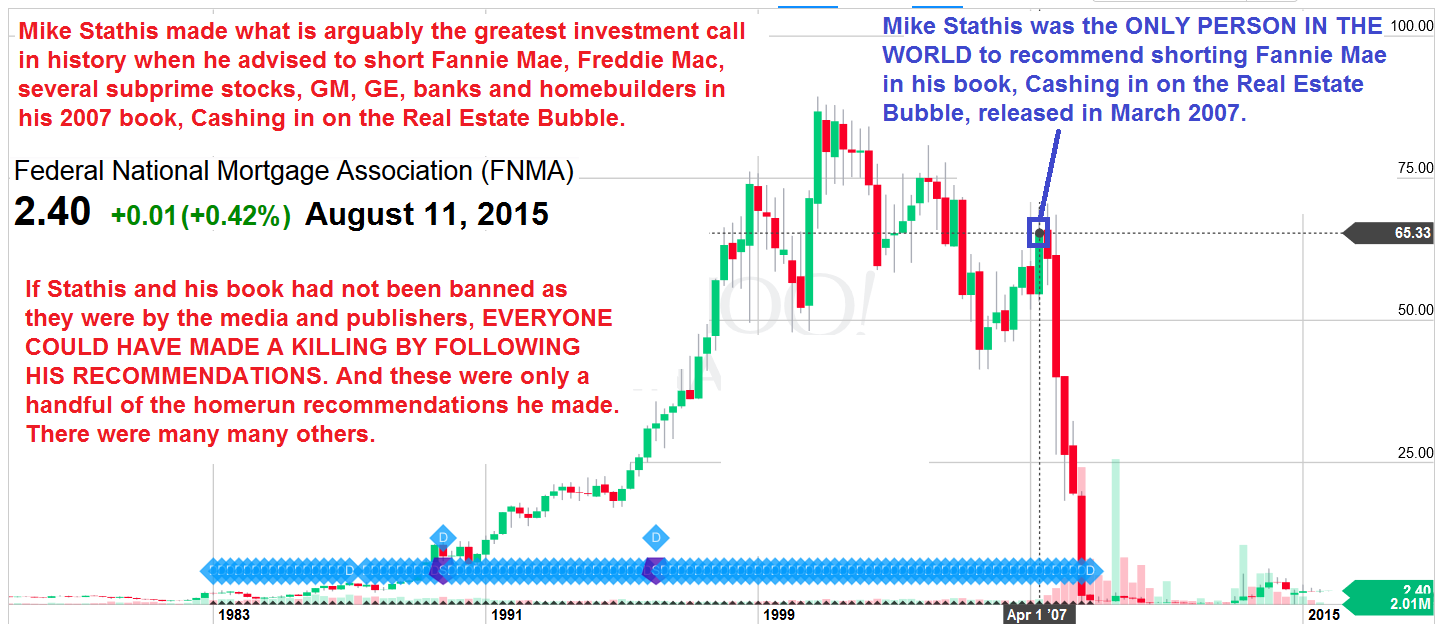
Stathis also released a book focusing on strategies to profit from the real estate collapse in early 2007.

The Jewish media crime bosses prefer to simply ignore those who speak the truth and threaten to expose them as the best way to hide the scams from the public.

In contrast, the Jewish media crime bosses continuously promote Jewish con men and clowns who have terrible track records as a way to enrich them all while steering the audience to their sponsors, most of which are Jewish Wall Street and related firms. Figure it out folks. It's not rocket science.


View Mike Stathis' Track Record here, herehere, here, here, here and here.


Membership Resources


__________________________________________________________________________________________________________________

Mike Stathis holds the best investment forecasting track record in the world since 2006.
View Mike Stathis' Track Record here, herehere, here, here, here and here.


Check here to download Chapter 12 of Cashing in on the Real Estate Bubble.


So why does the media continue to BAN Stathis? 


Why does the media constantly air con men who have lousy track records?

These are critical questions to be answered.

You need to confront the media with these questions. 

Watch the following videos and you will learn the answer to these questions:

You Will Lose Your Ass If You Listen To The Media


__________________________________________________________________________________________________________________


Despite the strong closing bounce off the new intraday low of around 7400 reached on Friday, it’s likely the Dow has further downside. These lows may not occur for another 12-18 months. Alternatively, they could occur at any time. The timing is impossible to predict in advance. The important thing to focus on is the likelihood that the market will head lower down the road. You should adjust your investment strategy to reflect this scenario.  

As I first reported in the 2006 edition of my book America’s Financial Apocalypse, the fair value of the Dow Jones Industrial Average was around 5500 by least-squares analysis (chart below). This was a very rough estimate that could be raised to as high as 6500.

While I mentioned I would “not be shocked to see the market collapse to this level,” I felt it was unlikely. I felt a series of crashes would push the Dow down to the 10,000 level where it would trade sideways for many years, only to mount a series of devastating crashes thereafter. Thus, even I am a little surprised how badly things have deteriorated in such a short period of time.


Figure 16-1. Historical Chart of the DJIA Showing Periods and Fair Value
 
 
Source: America’s Financial Apocalypse: How to Profit from the Next Great Depression. Original Edition, 2006.


[Now you hear about the self-proclaimed experts talking about the same analysis as I discussed in 2006, as if it were timely. You know who they are - the same clowns on TV who want you to think they warned you of this mess early on, when the fact is they were bullish up until a couple of months ago. Just check their track records and you will see for yourself. They rely on the fact that most investors have short memories.

I wonder how many of these guys reference my book and why they refuse to acknowledge my forecasts. I suppose they don’t feel they need to since I’m not part of the mainstream media con artists. I know for a fact my book made it to many mutual and hedge fund managers because I was contacted by some who specifically made me promise not to disclose their praise for my book, most likely because they did not want their clients to know this catastrophe was coming.]

However, since the release of this book, I have cautioned investors many times about a collapse down to the 9000 then 8000 and finally 7800 levels. Now I am telling you to watch out below. As you will see shortly, I expect considerable short-term upside before reaching new lows.

But you should note that the Fed and Treasury’s responses to the financial crisis have assured there will be even more devastating crashes down the road, most likely just as the market appears to be headed for another strong bull run. When this will occur I cannot say. But you can bet it’s going to happen. You can’t create trillions of dollars out of thin air without harsh consequences down the road. The effects will be even worse when you hold down interest rates for a prolonged period.

With the Dow hovering around 8000, the problem is that there have been absolutely no signs of capitulation whatsoever. What that means is that the Dow could fall much lower from current levels. Even worse, we are still at the early stages of the economic fallout. Consumers have not fallen yet and hedge funds have only begun to fail. Hundreds of corporations will file for bankruptcy and thousands of banks will fail. The results of the holiday season should begin another downward turn. I invite you to check back to a couple of articles I wrote a few months ago to serve as guidance for your investment strategy. See here and here.


So is this 5500-6500 level possible? Certainly. In fact, we know that during reversion to the mean, the stock market almost never goes exactly back exactly to the mean. Instead it overshoots. What this means is that the Dow could go lower for a period prior to gravitating around the mean. Keep in mind that as time passes, the market fair value will increase based upon the slope of the chart. 

Just from studying this basic chart alone, common sense would lead one to conclude that the stock market is headed for an additional 10 to 15-year period of poor performance. When you consider the economic data, things look much worse.

If you think this isn’t possible, you’ve most likely been watching too much TV or listening to Wall Street. Just ask Japan about this possibility.

Have a look at the 20-year performance of the Nikkei 225 below. After reaching nearly 40,000 in 1989, the Nikkei is still down by over 75%. But as you can see, it didn’t crash over a short time period. It has been in a downward trend since 1989. 


Now back to the Dow. Last Friday the Dow recently hit a critical support level (7800) and briefly broke below it (7449), although it mounted a strong rally to close just above this 7800 level. You should recall that the 7800 level was the previous intraday low made a few weeks ago. I hope you’ve been noticing these new intraday lows that rebound on close, only to be broken again a few weeks later. This has happened several times in 2008.


The good news is that the sooner and more intense the fallout, the sooner the market will recover. But you shouldn’t expect another bull market period for a long time. Notice I said bull market period as opposed to bull market. While we might experience “bull market” performance in the future, they will be followed by bear market performance. But a sustained period of strong performance is unlikely at this point. Overall, we will continue the secular bear market for many years as I predicted in my 2006 book.

Note that I like to use basic charts for a good reason. I want to illustrate that you do not need to get real fancy in order to see what’s happening. In fact, many times the fancier the chart is the more one can get distracted from the basic information.

Short-term Rally?

On the bright side of things, I am becoming increasingly optimistic of short-term upside of around 15-20% through the end of January. If this rally does materialize, you should expect it to be erased shortly thereafter once Christmas earnings are reported.

One thing is for certain. The stock market will be filled with tremendous volatility throughout 2009. And the economy is only going to get worse. There will be periods of optimism followed by deepening realities. As a result, this will continue to be a market only for the best of the best traders.

All others should consider staying out, select only safe-dividend stocks or start building positions in Chinese stocks like an ETF index (FXI).

Remember, there are going to be hundreds of hedge fund blowups and corporate bankruptcies. Many companies will slash or eliminate dividends so you need to stick with only the stocks with the best financial and business strength to ensure dividend payout.

As you might know, some of the biggest and best-known investors have been blown out in 2008, from Griffin at Citadel, the great bear himself Jeremy Grantham, and even the overrated Warren Buffett, not to mention many others (I’d mention Pickens’ blowup but I wouldn’t dare place him in this group of investors – the man is full of hot air). Keep that in mind before you decide to take on this market. If you are an investor with a horizon of 20 years you should start buying, but slowly and only after major sell-offs.

I continue to like healthcare, specifically Pfizer and a handful of HMOs like United Health and Cigna (at current levels). I’ve also recently taken a position in Alcoa and I am eye-balling Dow Chemical. As well, I am rebuilding positions in oil trusts such as Pengrowth and Harvest Energy. But these are intended to be long-term positions and I’m willing to accept further downside, so I am building my positions accordingly.

Soon I’ll be looking to enter gold and maybe silver. For those of you who missed the previous bull run in these metals, you’ll have another opportunity to catch a ride back to the top. However, I wouldn’t jump aboard until I see a strong surge, as there’s still another potential 10-15% downside. Anything more would be reason for concern and could cause a major trend reversal. If this market rally does occur, it is likely to take gold up with it. And when the next market correction occurs, this time gold might not sell off. It could soar.

I’ve cautioned investors on numerous occasions about the absolute need to trade the precious metals’ volatility. The buy-and-hold approach isn’t going to work. In fact, it’s more deadly than using it with stocks because stocks generally tend to go up over time while gold eventually reverts back to historical levels.


The dollar maintains its recent strength but only as a safer haven to other currencies, excluding the Yen. Once the investment community realizes the increased credit risk of the U.S. government, the dollar will reflect its true value. Most likely, this time will occur once the economic storm has bottomed and begins to show signs of improvement. Mind you this is just speculation. The only thing I am certain of is the inherent weakness of the dollar. But as we all know, assets can remain over- or undervalued for a very long time prior to correcting.

Understand once again that commodities are highly volatile. So you should take profits when you can because stocks go down much faster than they go up. And the market bottom is ahead not behind us. No matter how much I like any investment, you’d better believe I’m going to continue to take profits when I can because avoiding market risk is the top priority. Cash is king and those who have it for market crashes will be poised to do very well.  

All of that said, you shouldn’t take any of this to be investment advice because everyone has different resources, objectives and skills. And my perspectives are based on assumptions that are not likely to match your own situation. As well, regardless how right I might be today, things can change very quickly. Those who think they can profit merely by reading weekly posts during one of the most difficult markets in history are as naïve as they are soon to be broke.  


Copyrights © 2024 All Rights Reserved AVA investment analytics